Benchmarking
Pfarah is fast. Pfarah takes advantage of the shape of the data to supply hyper-optimized functions that far outstrip the .NET's own libraries. It used to be the case that determining if "1.000" was a number, a datetime, or just a plain string consumed most of the CPU time when parsing. After writing optimized functions, the previous bottleneck is barely a blip.
I would like to state that for 99% of use cases, .NET's own libraries are sufficiently fast as they can handle any format and culture. It's only when one can make certain assumptions about the data can optimizations be utilized.
Using BenchmarkDotNet, the
following breaks down the performance difference between Pfarah's
hyper-optimized functions (prefixed with pfarah) and .NET libraries (prefixed
with bcl). I'll call out performance characteristics of both the happy path
(eg. parsing strings that are dates/numbers) and parsing the sad path (eg.
parsing strings that are no dates/numbers). Often the sad path is even more
important than the happy path when parsing a file with very few numbers and
dates.
1: 2: 3: 4: 5: 6: 7: 8: |
|
Parsing Doubles
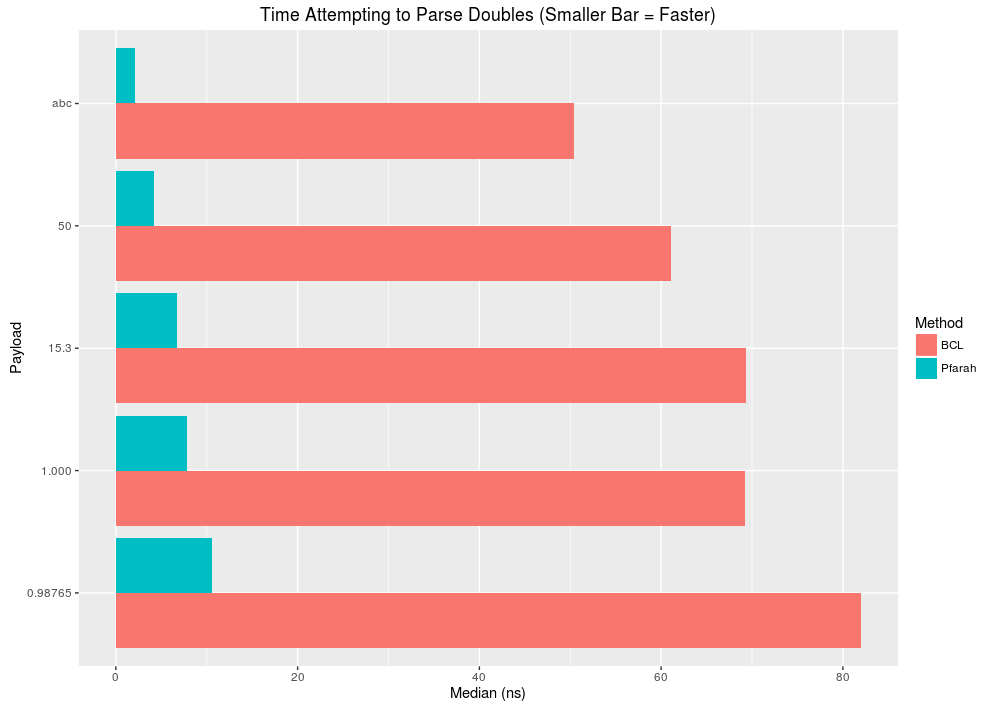
- Happy path: More than 10x improvement for simple numbers (50). As numbers grow complex (more numbers, decimals) performance improvement drops to 5x.
- Sad path: 15x improvement for data that obviously isn't a number (abc)
Parsing DateTimes
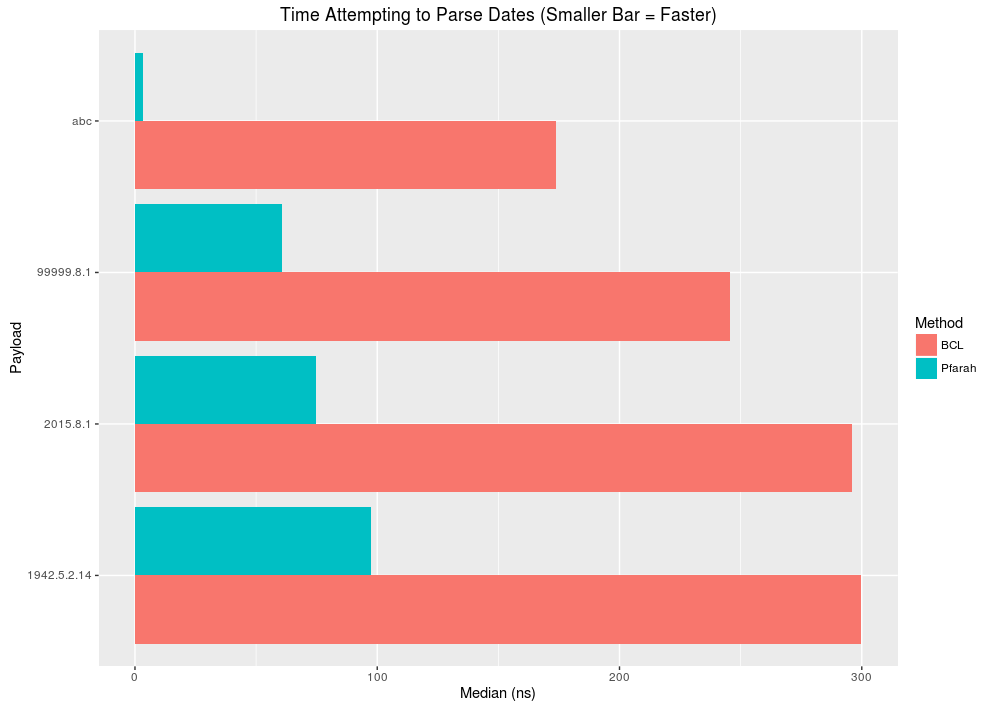
- Happy path: 3-4x improvement depending on if the hour part of a date is omitted.
- Sad path: > 40x improvement for data that obviously isn't a date (abc), but if the date is closer to an actual date, then performance improvement drops to 5x.
Squirrelling away the code used to generate the plots from the csv output from BenchmarkDotnet
1: 2: 3: 4: 5: 6: 7: 8: 9: 10: 11: 12: 13: 14: 15: 16: 17: 18: 19: 20: 21: 22: 23: 24: 25: 26: 27: 28: |
|
